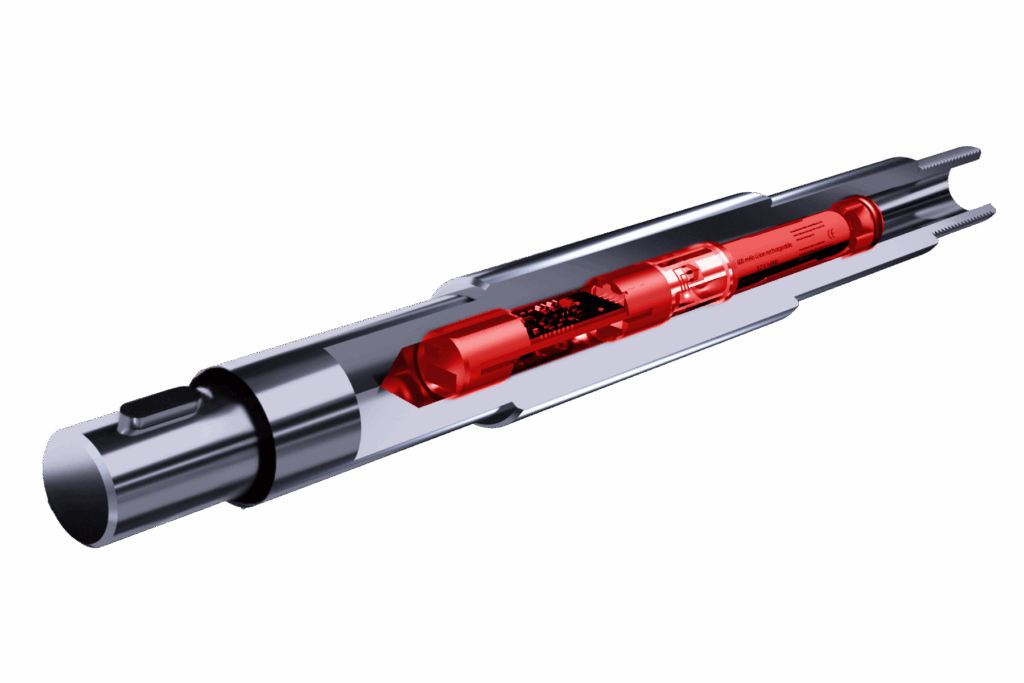
coreCLOUD

Visualization, monitoring, analytical processing, and storage of live and historical data in the cloud

  • Low-latency monitoring of live data
  • Historical data, notes and warnings
  • Branding and custom dashboards available
  • Integration and API available

Powerful platform for fleet, device, and event management

In the device management section, battery level, location, and alert lists can be displayed for each measuring amplifier/sensor. User management allows for the creation of different user types with varying access rights.

Display and measurement data management

Live measurement data or the entire measurement data history can be displayed for each sensor channel. An intuitive measurement data view, including a zoom function and quick access to historical data, enables easy handling of even large volumes of data. Measurement series can be exported and downloaded as CSV or Excel files, as well as screenshots, with a single click.

Individual dashboards with configurable widgets

Widgets such as speedometers, bar charts, and warning elements are available as standard. This allows desired interpretations and recommendations for action to be displayed graphically: for example, when the next maintenance is due. Events such as overloads can be displayed in clusters, and a click provides detailed information. Usage diagrams enable the visualization of usage intensity over a defined period. Threshold violations can be counted, and damage amounts can be calculated directly.

Rule chains and algorithms

From simple, rule-based logic to complex analytical processes – scalable in custom services.

Versatile interfaces – maximum security

A REST API interface is available for integrating coreCLOUD into external systems. For the best possible security of your data, we also offer custom hosting upon request.

Information and options for the measuring chain

The modular construction kit from core sensing enables a wide range of options for mapping the measurement chain according to the respective application. The focus is always on energy-efficient, wireless transmission of the measurement data.

Sensors

Generation of measured values with different sensor principles
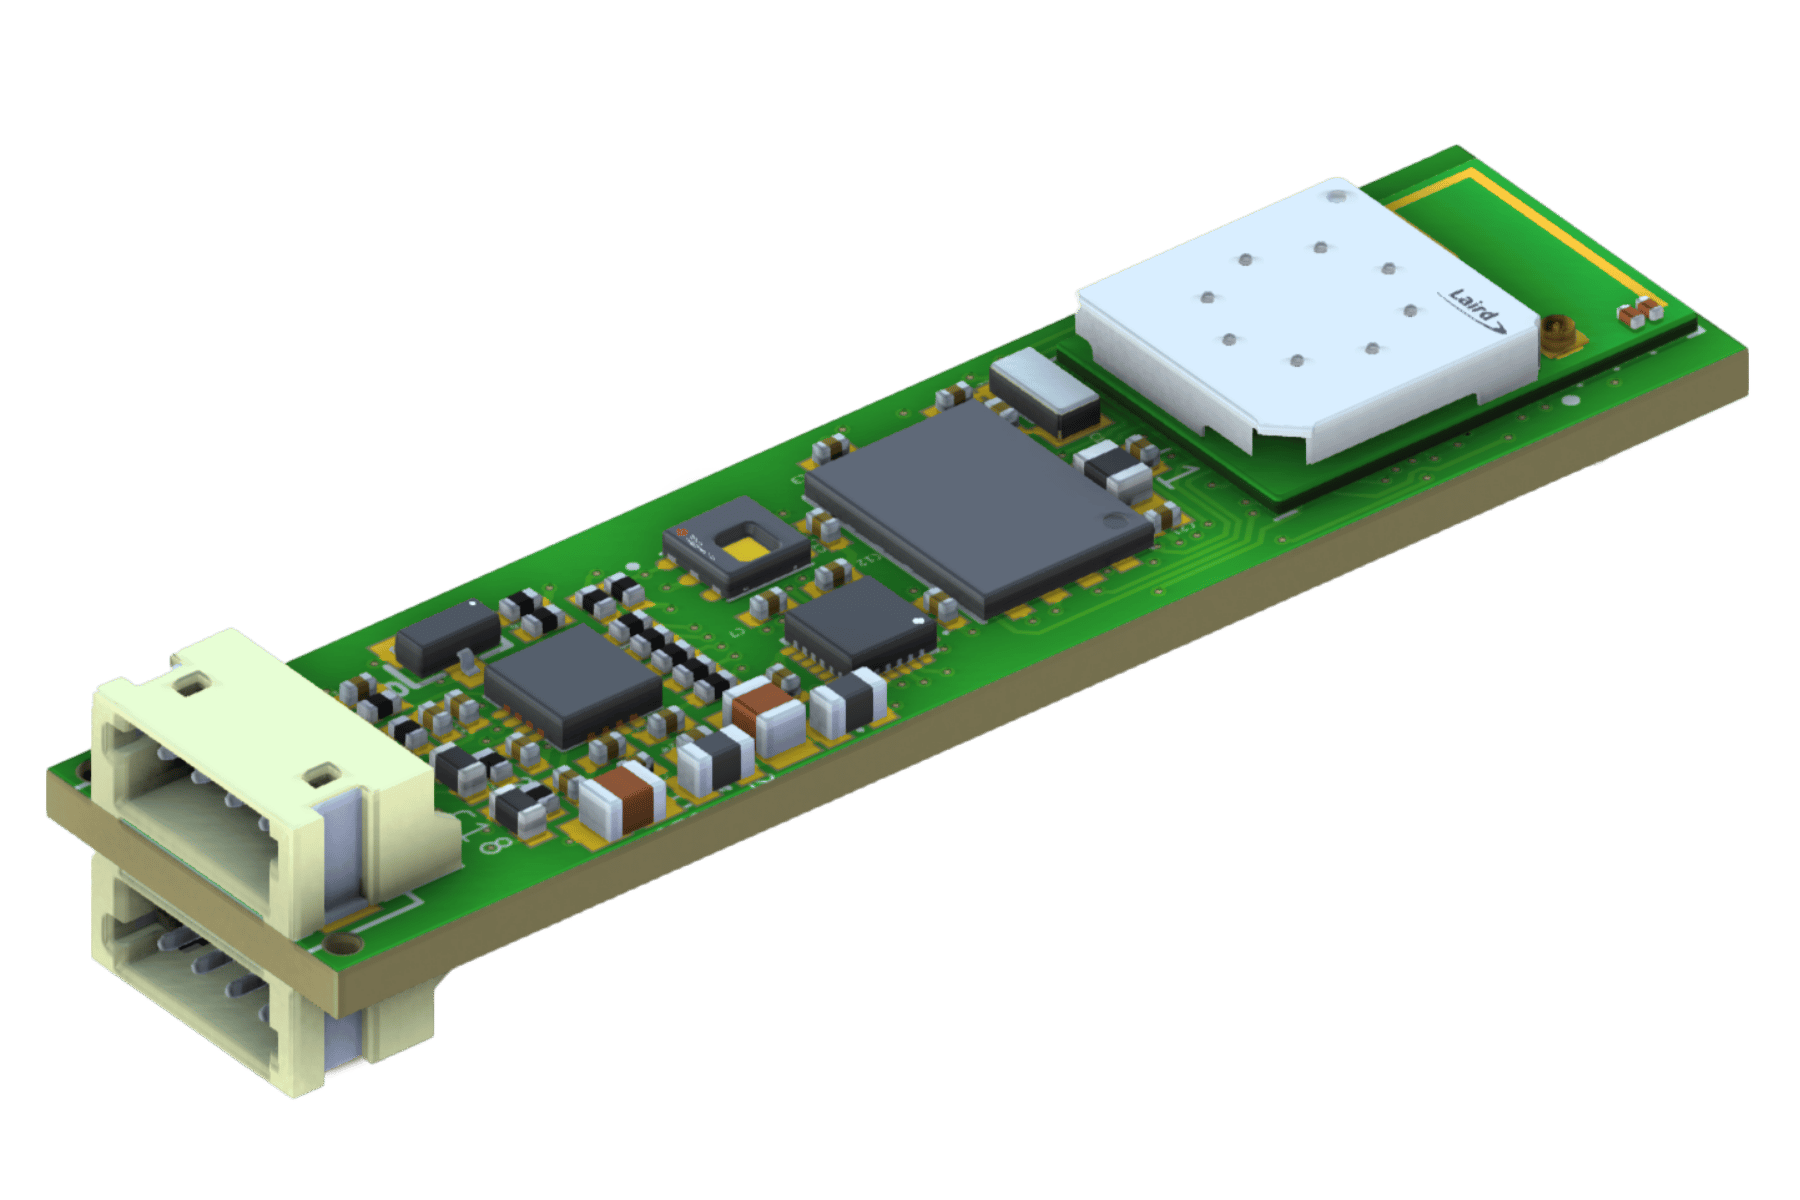
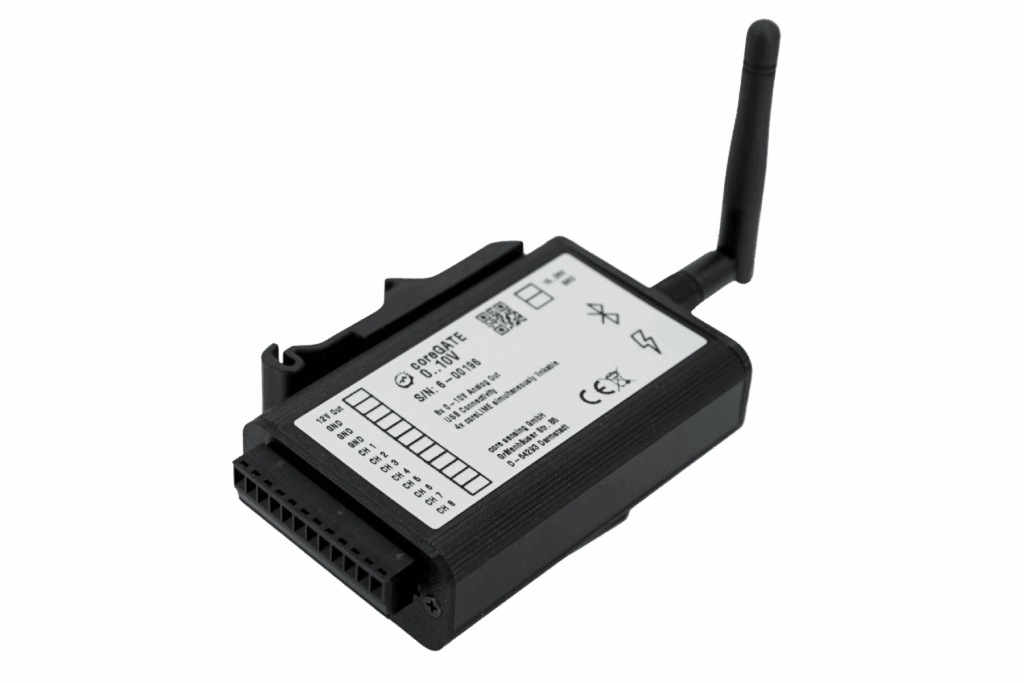
Data acquisition

Amplification, digitization and fusion of measured values
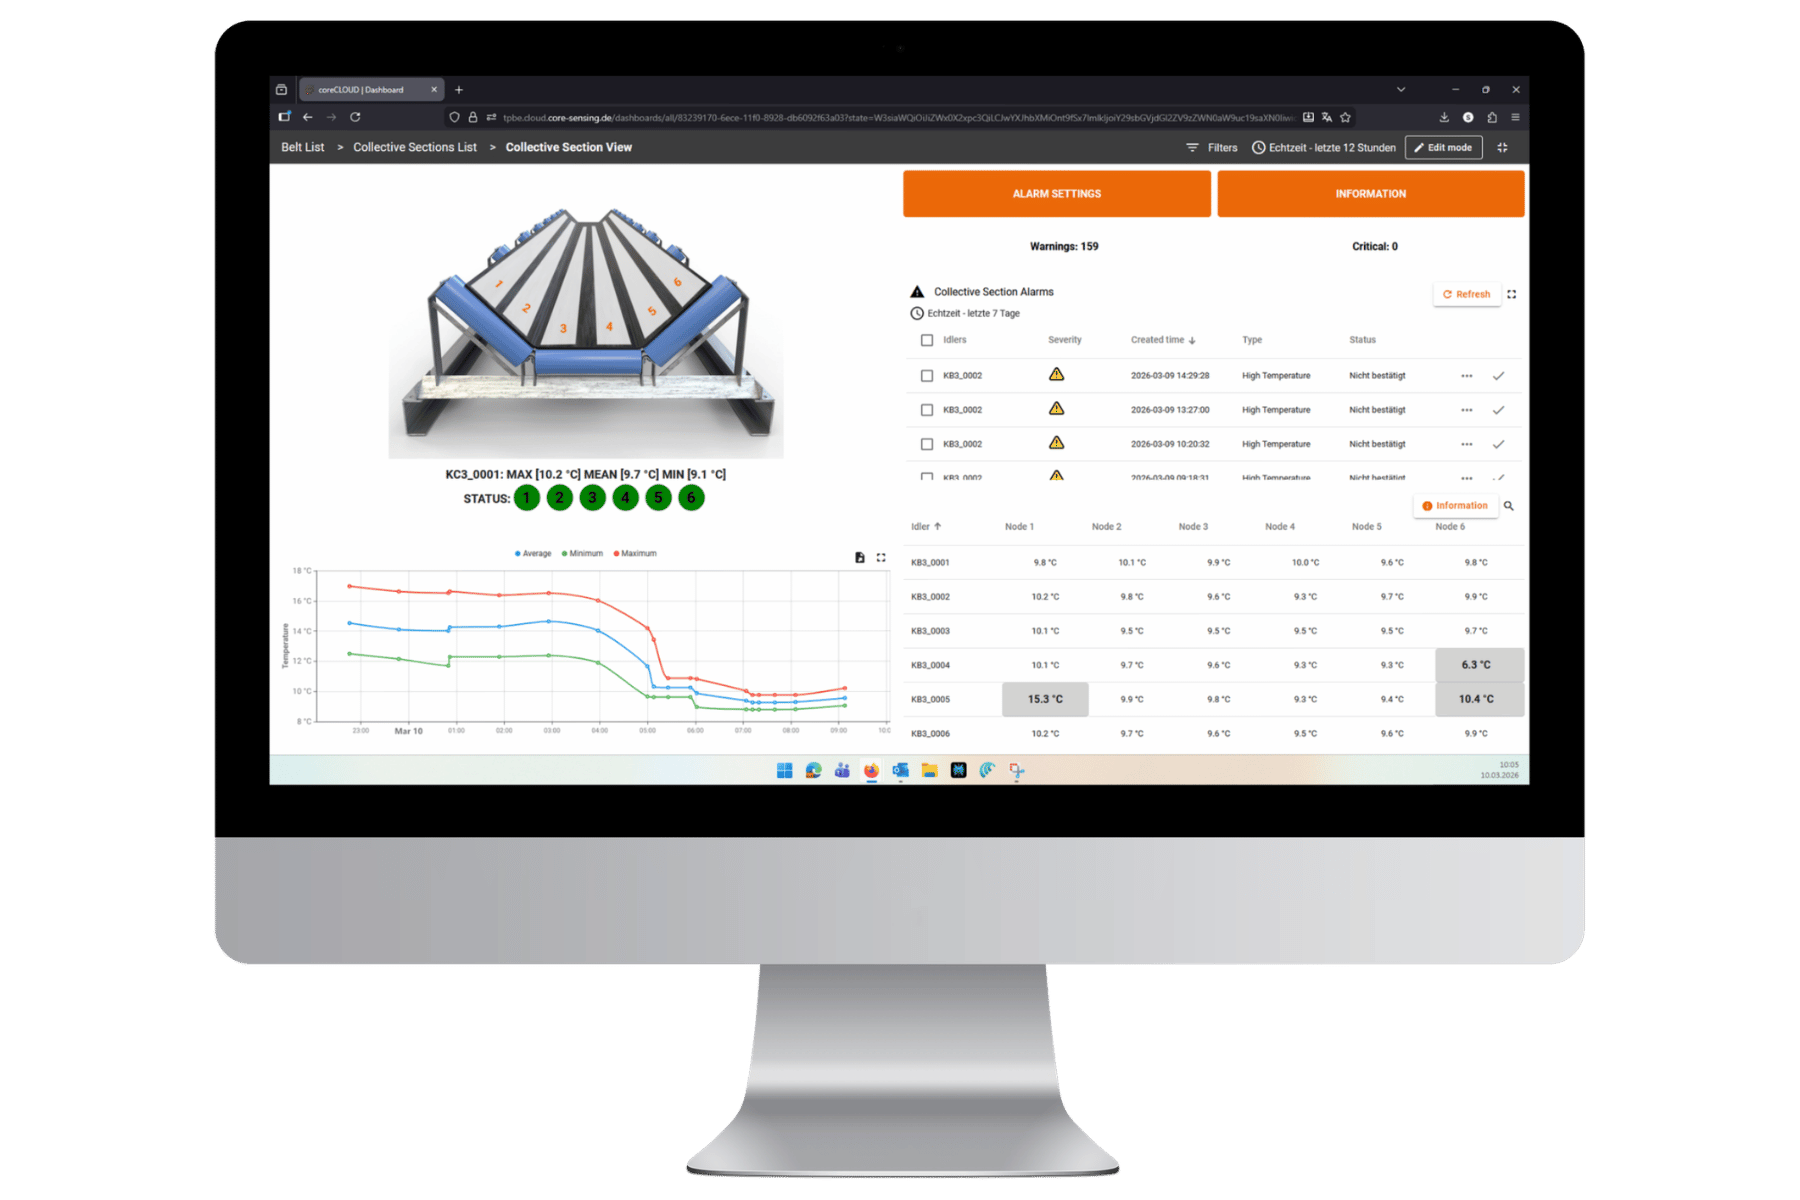
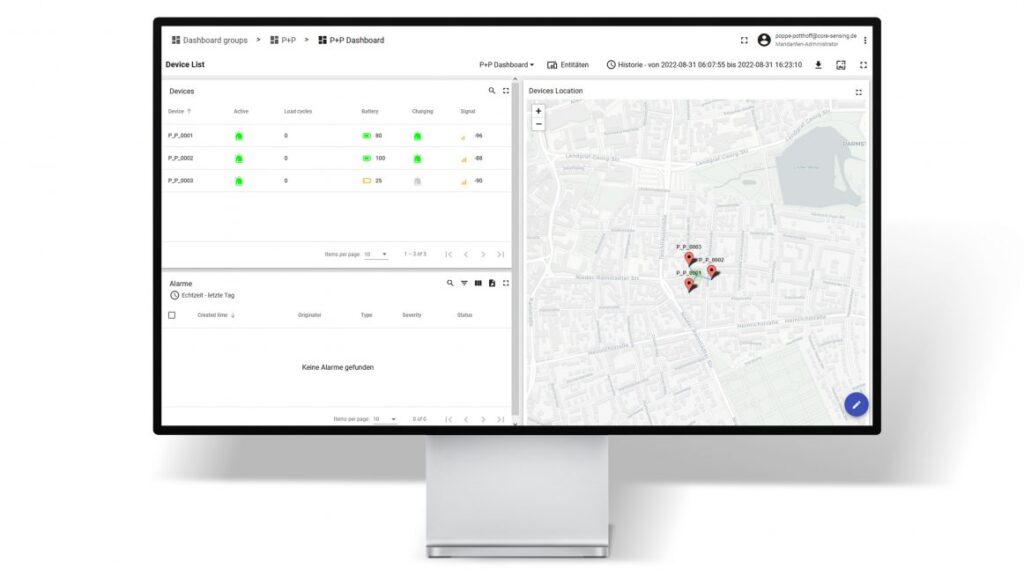
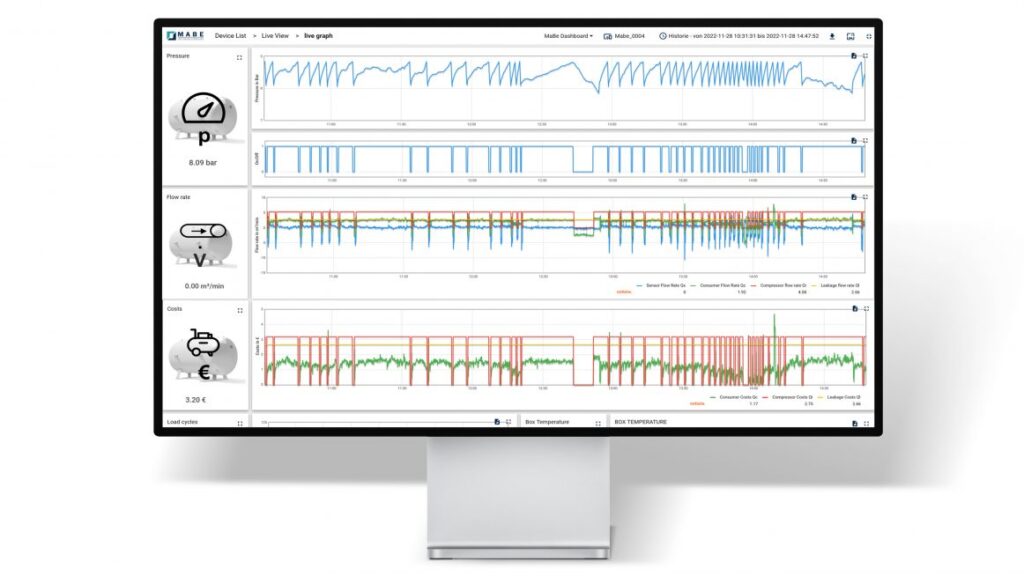
Data provision

Provision of measurement data for final use

  • coreLIME – wireless measuring amplifier
    • Acceleration
    • Gyroscope
    • Speed
    • Temperature
    • Air humidity
  • coreIN – Wireless sensors
    • Wheatstone Bridge
    • coreLIME
  • Compatibility with a wide range of sensors and sensor principles
  • coreLIME & coreMOBILE
    • Configuration of the sampling rate & provisioning intervals
    • Logging and events (threshold values)
    • Data pre-processing with DSP Toolbox
    • Compatibility:
    • Wheatstone bridges (strain gauges), full bridges, half bridges, quarter bridges
    • Pressure sensors
    • Sensors with analog signal output (0…10V, 4…20mA)
    • Sensors with I2C & SPI
    • We would be happy to advise you on other sensors and interfaces
  • coreVIEWER – free mobile app
    • Live view
    • Export CSV Log
    • Analysis CSV Log, Toolbox
  • coreGATE – Gateways
    • USB
    • 0…10V
    • CAN bus
    • RS232/422/485
    • TCP/IP
    • MQTT
  • coreCLOUD – Analytics & API
    • Dashboard
    • Rest API

Request more information

Send us a non-binding inquiry for further information.

Related products

coreIN

Integrated force and torque sensors for hollow shafts with rechargeable battery, battery, or induction

■ Sensor integration into customer-specific components
■ Specifically for mobile and rotating applications
■ Torque, force, and bending possible

coreGATE 0–10 V

Gateway for connecting up to 10 Bluetooth sensors based on coreLIME measuring amplifiers with a 0…10V interface

■ DIN rail mount for convenient attachment
■ 12 V output voltage, e.g., for stator induction
■ Live display and configuration with the coreVIEWER app